Resources for every stage of your journey home
Skip to the end of the carousel
 Buying6 min read
Waterfront Cities Dominate Zillow’s Hottest Markets for 2024
Homes in these relatively affordable markets sell faster than the national average – in some cases, in as little as 11 days.
Read article Buying5 min read
A Therapist's 6 Tips on How to Compromise With Your Home-Shopping Partner
Licensed marriage counselor Lauren Cook-McKay shares what to do when you can’t agree.
Read article Buying4 min read
Zillow’s Top 10 Most Popular Markets of 2023 Have One Thing in Common: Size
See which seaside and vacation towns made the list.
Read article
Buying


Financing

0 min read
Credit Score Quiz for Home Buyers: How High Can You Score?
If you're shopping for a mortgage, it can pay to know the facts when it comes to credit scores. Test your knowledge to get started.

14 min read
21 Creative Ways to Save Money for a Home Down Payment

8 min read
How to Get a Mortgage Pre-Approval
7 min read
Can I Buy a House With Student Loan Debt?
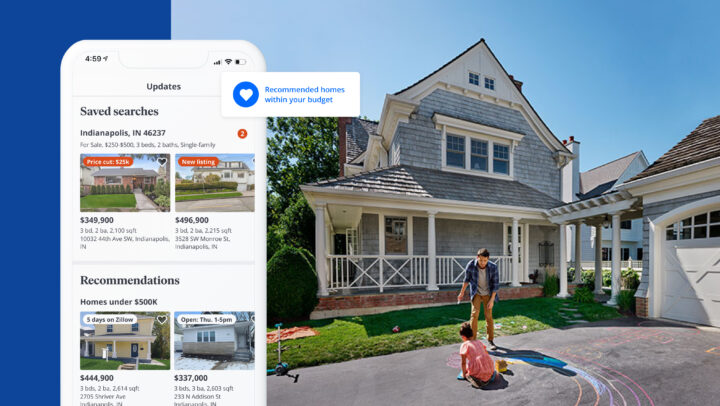
Download the Zillow App
Don’t miss out on the right home for you — browse up-to-date listings, refine your search and more.
Download the free app
Selling


Renting


Owning

9 min read
Best Home Improvements to Increase Value
Renovating doesn't always mean big returns. See which improvements pay off when you sell.
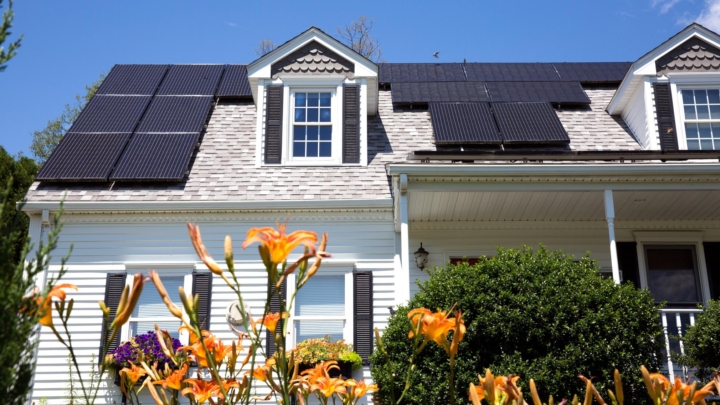
12 min read
A Homeowner’s Guide to Going Solar

7 min read
7 Retro Design Trends That Will Make Your Home Cozy
15 min read
